Reflection on 3 Act: Lego Slide

We combined our first grade classrooms today for the 3 Act lesson I just completed on comparing lengths.  This was a different format than we had used before for 3 Act lessons.

I thought this was the perfect time to try out the fill in the blank feature on Nearpod (see below).  In Nearpod, I type in the sentences I want to use and highlight the words that should be in the word bank.  When the students see the question, the boxed words show up in the word bank at the bottom of the screen and they slide them to their correct positions.  2016-04-22 15_05_35-Nearpod Lessons_ Download ready-to-use content for education

Students shared iPads in partner groups to discuss the lesson.

The more we introduce 3 Act tasks in first grade the more focused they become, but we often need to funnel student questions sometimes when we ask, “What do you notice, what do you wonder?” so that they focus their attention on how the video relates to math questions.

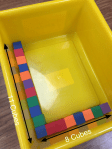
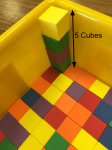
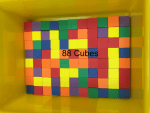
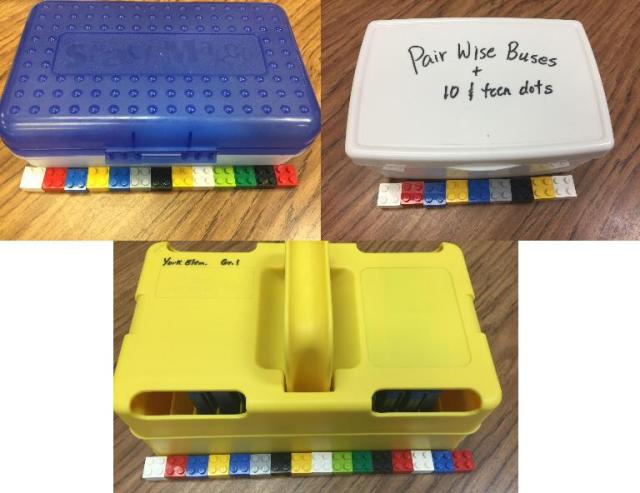
It was really interesting to see and hear students during the Act 2 video, because they choral counted the length of each box as they were laid out in the video.

We made an anchor chart for them to refer back to during the prove it portion of Act 2 that looked like this:

IMG_4971.JPG

The question we presented for Act 2 was: “Which box is the shortest?  Which box is the longest?”

As students were drawing and reasoning about which box was shortest and which was longest, we noticed that many groups were struggling with recording their thinking.  The act of organizing their information into a drawing or equation that would answer the question was causing a lot of great conversation between partnerships.  The two first grade teachers and I joined groups and probed for specificity in their solutions.  Many students drew a solution and submitted it quickly without checking and discussing with their partners to agree on what to submit.  This brought up a great teaching point on what types of checks we should perform before submitting answers.

When we asked groups to share their thinking, we started with this one:

2016-04-22 13_17_47-Nearpod - Reports I started by asking, “I’m a little confused about this one, is anyone else having trouble with this drawing?”  Several students raised their hands and I asked them to share.  One student said, “there aren’t any green or red boxes.  They are blue, white and yellow.”

I said, “yeah, that’s what I was having trouble with.  What was your thinking here?”  One of the students from this partnership said, “that’s the Legos.”  I said, “oh the red and green are the Legos.  Does anyone have any questions for them about that?”  A student raised his hand and said, “we were measuring the boxes, not Legos.”  So I replied, “does this picture tell us which box is shortest or longest? ”  The students said “no.”  I said, so how could they make this better so that they answer all parts of the question?” Students: “draw the blue, white and yellow boxes.”  “Okay, that sounds like that might be a good strategy.  Do you agree that would help your audience see your thinking?”2016-04-22 13_17_02-Nearpod - Reports

The next group that shared, showed the drawing to the right.  When I asked them about their drawing, they said, “The yellow box is the longest.”   I said, “oh, what is this in here?”  The student said, “that is the 16 because it is 16 long.”  I said, “oh so you labeled it so we would know how long it was. Are these the legos that were used to measure?”  Student: “yes.”  Me: “Okay, can you tell us more about your picture?”  Student: “No.”  Other teacher, “you said you drew that box over there for something.  What is that?”  Student: “Oh, that is the white box.  It’s the shortest.”  Me: “So what do we think of this drawing?  Does it answer the question?  How could this drawing be improved to prove their thinking?”2016-04-22 13_10_42-Nearpod - Reports

The drawing on the left is the next drawing.  It is very similar to the one directly underneath it.  When the students showed this drawing, I said, “tell me about your drawing.  I see some numbers.  Are these the boxes?”  Student: “yes, the yellow is the longest.” Me: I see a 16 in both the yellow and blue, tell me about that.”  Student: “well the blue is not supposed to be 16, it is 13.”  Me: “Okay, so you just labeled that incorrectly?  Which one is the 2016-04-22 13_19_32-Nearpod - Reportsshortest?”  Student: “the white one.  It is only 9.”  Me: “9 what?”  Student, “9 legos long.”  “Oh, okay.  I see the numbers and I see how you labeled the yellow one long.  That helps me to know your thinking.  What could you add to the white box to let me know your thinking about that?”  Student: “shortest.”  Me: “yes, that would help me to know, how about you class?  Would that help tell us know which is the shortest?”

We always wish we had time to look at all of the solutions more in depth, but by this time our 1st graders attention spans have reached their limit.  Our plan is to start using peer conferencing for each group to have the opportunity to share with another group and receive feedback, but first we have to set the expectations and the protocols so that they have an idea of what descriptive feedback looks and sounds like.  The conversations we hear kids having with each other elevate each time we present them with a new 3 Act task.

Below are the remaining solutions.  Look through the drawings and determine what questions we might ask to help students identify and think through precision and detail when solving problems.
2016-04-22 13_11_21-Nearpod - Reports

2016-04-22 13_12_02-Nearpod - Reports
2016-04-22 13_18_12-Nearpod - Reports2016-04-22 13_18_26-Nearpod - Reports
2016-04-22 13_18_53-Nearpod - Reports
2016-04-22 13_19_47-Nearpod - Reports

Making Surface Area Visual

One of the students I tutor is a sixth grade girl.  When she came to me,
she was struggling with math anxiety.  When I gave her the Math Add+Vantage assessments it was apparent that she had very little number sense.  She struggled with composing and decomposing numbers with the help of structures such as ten frames and rekenreks and she had almost no concept of subtraction.  She was TERRIFIED of math and when I asked her a question she would just start throwing out answers and correcting herself.  It broke my heart.

To begin I had to get her feeling successful in math.  For the first couple of sessions, we just worked on working slowly and talking about strategies.  We played with fraction tiles, cuisenaire rods, rekenreks, ten frames, counters, dice, etc.  We played math.  We talked about what made her nervous and what she felt like she was good.    Most of all, we spent a lot of time working on structuring to 10, to 20 and to 100 and she has made great strides.  It was apparent with her from the beginning that she had not been provided concrete practice or examples in her early math experiences.

When she was working on fractions, she depended entirely on “tricks” and sayings to remember what to do.  The “why” was missing completely.

Last week, she failed a test on surface area and volume.  Her teacher was going to let her retake it the next week.  When we met to discuss it, it became clear that she needed 3 dimensional objects to connect back to.  When I asked her how many faces were on a rectangular prism she thought it might be 4.  We worked through some problems, but she continued to have difficulty visualizing the prism and was inconsistent in her answers.

This week I came prepared to provide those experiences.  She seemed to have a pretty good grasp on area, but volume and surface area were not sound.

I realized she needed to actually see me unwrap a rectangular prism into faces.

I provided this example:Drawing SA

I brought a rectangular prism and had her touch the faces.  I had her count them and we discussed how many numbers she might have for the area of each face.  She said 6.

I then provided her with a piece of graph paper and had her draw each of the faces (and shade the area).  We discussed that two faces are identical and found them on the prism as she drew.  She labeled them as we went with length and width.Concrete SA

After she had all of the faces drawn, I asked her how she would find the surface area of each.  She added the length and width.

I said, “Count the shaded squares inside and see if that works out.”

She replied, “Oh! It’s multiplication!”

I then asked, “How many surfaces are there? “

“6.”

“So how many products will you have all together?”

“6.”

“So what do you do with all of those products.”

“Add them together?”

“Does that make sense?”

“Yes.”

“Why?”

“Because it will be the total area of all the faces.”drawing 4.png

I then had her try another problem using graph paper and asked her to try not shading the areas this time.

She was able to do that pretty easily, but she stopped drawing after four faces and I asked her how many faces she had so far.

She still struggled with the last set of faces.  We talked about which dimensions she had already used and she was able to draw the remaining two faces.  Visual.png

When she added the products I made note of some strategies we needed to look at for addition in a later lesson.

I asked her the units and she knew they were “squared” but we had to discuss how to show that in the answer.

The prior week we had talked about 2-dimensional shapes and how when we find area, the product is 2 factors which gives us units squared, but when we find volume it is a 3-dimensional shape and the product of 3 factors is units cubed.  She seemed to have retained that.

Drawing SA 3.png

Since she was having so much trouble with deciding which factors to multiply in the last two examples, I wanted to provide her an example that had two factors that were the same and see what she did with it.

This time I told her I was going to take away the graph paper, but that she could recreate it with a drawing.  I modeled the first one and then let her work on it.Representational.png

She did as predicted.  She just chose some numbers she saw and multiplied.  I asked her to identify the dimensions she was multiplying and she did, but still didn’t notice the problem of her 8 x 8 square.  I asked her to show me the two eights on the square she drew and she found her mistake.

She said, “Oh!  Now I get it!”

She continued with this example and then we moved on to a review on volume.

I asked her if she remembered the formula for volume and she said, “yes, length times width.”  I said, “isn’t that the formula we just used for area of a face?”

She said, “yeah.”volume.png

I pulled out my phone and showed her the video from the 3 Act Task, Stack Em’ Up and then drew this picture for her.  We talked about how it is three layers of 32 and she was able to tell me the formula was length times width times height.  I had her work a few problems and she did so with no problem.

I cannot stress enough the importance of making math visual for students.  This brilliant little girl has felt like a failure her whole life in mathematics because she was not given the tools to succeed.  This must not continue.  She can now solve simple subtraction problems with ease and mentally add and subtract 3-digit numbers using strategies such as compensation.  All because we took our time and connected the concrete -> visual -> abstract.

Most importantly, her attitude about math is changing.  She is more confident in her answers and she has strategies to prove it.  In my opinion, that is her greatest success!

3 Act: What Comes Next?

I was working on a graphing task for first grade with color cubes and thought they would be a great prop for number patterns.  This task addresses standard 1.OA.C.5: relating counting to addition and subtraction.

Act 1:

What do you notice?  What do you wonder?

What comes next?

Act 2:

Act 2 Colors.png

act-2-labeledAct 2.png

How many purple cubes will there be?

How many blue cubes will there be?

Act 3:

Share your strategies.

3 Act: All the Little Duckies

I was in a 2nd grade room the other day and a teacher was presenting a lesson on measurement using customary units.  Students were using rulers to measure to the nearest inch.  One of the students asked, “what if it is over 4 inches but not 5 inches?”  The teacher said, “you choose.”   I walked over and whispered, “actually let’s round up if it’s at a half and down if it’s before half because when they use rounding in 3rd grade next year, that will provide them the visual representation to refer back to.”

This really got me thinking again about the power of vertical teaming.  This teacher didn’t know that this is a common misconception in 3rd and 4th grade.  She also didn’t know many of the misconceptions around measurement.  She anticipated that they might start with something other than zero, but she didn’t know to address that in 2nd grade we are measuring units without precision and that vocabulary such as “about 5 inches” is necessary.  Or that conversations about which one to choose would be necessary.  In the task below for standard 2.MD.A.2, I hope to have students dig into discussions about which number to choose and why.  I want them to defend their reasoning and discuss which would be more accurate.  This will allow students to reason with numbers and will carry over to rounding, to estimation, and to looking for reasonableness in their answers in years to come.

The Common Core Standards specifically state in 1.MD.A.2 to ” Limit to contexts where the object being measured is spanned by a whole number of length units with no gaps or overlaps.”  That is the reason that I used standard 2.MD.A.2 for this task.  In my opinion, this task is very appropriate for first grade and kindergarten students as well.  That conversation cannot happen early enough!

Act 1:

About how many ducks long is the math rack?

About how many cubes long is the math rack?

Act 2:

IMG_4871.JPG   Duckies Act 2.png

About how many ducks long is it?  Why did you choose that number?

There are 4 more cubes than ducks.

About how many cubes long is it?

Act 3:

IMG_4872.JPG

Were you correct?

If so, what were you thinking?

If not, what was your thinking?

3 Act Task: Lego Slide

Our 1st grade teachers are jumping into 3 Act tasks and asked me to find something that addressed non-standard measurement.  I made a couple of them that I will be posting. The standard addressed in Lego Slide is 1.MD.A.1 and it has students compare lengths of 3 objects.  See the nearpod here.

I was a little indecisive on which photos and videos to choose for this one, so I included all of them.  I chose to go with a fill in the blank comparison using vocabulary shortest and longest because this is what the data from our iReady assessment highlighted as a weakness for our students in first grade.  When I went to the unpacked standards for 1.MD.A.1 I saw an example of a logic type problem for this standard and really liked that. You may choose to go a different route.

Enjoy!  And as always, comments and suggestions are greatly appreciated!

Act 1:

Which box is longest?  Which is shortest?  Estimate.

Act 2:

Act 2 drawing pic

Which box is longest?  Which is shortest?  Prove how you know.

Fill in the blanks:

The white box is shorter than the blue box.

The yellow box is longer than the blue box.

The yellow box is longer than the white box.

The blue box is shorter than the yellow box.

Act 3:

all boxesall numberswhite blueyello whiteyellow blue

Were you correct?

Who is willing to share an incorrect solution?

Who is willing to share a correct solution?

What’s the math?


3 Act: Color Cubes

This task has 6 categories, but I think it is accessible to 2nd graders to address standard 2.MD.D.10.

Act 1:

What do you notice?  What do you wonder?

Estimate.  How many of each color cube are in the basket?

Act 2: 

act-2

There are 6 yellow cubes.  There are 2 more green cubes than yellow cubes.

There are the same number of orange cubes as red cubes.  There is one more orange cube than green cube.

There are the same number of blue and purple cubes.

There are 4 more purple cubes than red cubes.

graph

Use the graph to to help you organize the data.

How many of each color cube are in the basket?

Act 3: 

Was your solution correct?

Who is willing to share a strategy for a correct solution?

Who is willing to share an incorrect solution?

What’s the math?

3 Act: What a Gem

One of our first grade teachers could not find a 3 act task for measurement or data analysis this week, so I made this data analysis task for 1.MD.C.4.  Here is a link to the Nearpod lesson.

Act 1:

What did you notice?  What do you wonder?

How many gems are in the box?  Estimate.

What do you know?  What do you need to know?

Act 2:

Act 2 JPEG

Graph.jpg

We decided to use this graph as an extra scaffold, but you could leave it out and have them draw their own bar graph.

Act 3: 

Was your solution correct?

What was the math you used?

I would love feedback on this one!  How can I make it better?

Subitizing and It’s Role in Place Value

I recently was working with a first grade teacher meeting with a student who was struggling with recognizing numbers on the 100 rack when flashed on Dreambox (see picture). 2016-04-11 21_23_05-DreamBox Learning MathWhile the teacher was working with her, it became apparent that the tool was not automatic for her in subitizing numbers to ten.  When she was flashed a two-digit number, she had no idea what to pay attention to in the few seconds she had to look at the image.  She was not seeing the structure that the rack provides.  It became apparent that she needed some strategies to apply structure and meaning to the tool in order to be successful at subitizing large numbers.

I recently ordered 100 racks for teachers to use in small group with students. The teacher pulled that out and was working with her to build the number that she saw.

I thought we might need to pull her back to the 20 rack and work on showing numbers to 10 with one pull, but I thought we would stay with the 100 rack for now and do the same.  When she started to pull over the beads a few at a time.  I asked her to stop and think of what 6 might look like?  What did she know about the beads that could help her?  She wasn’t sure how they could help, but when I asked her how many red beads were on top and how many white beads, she said 5 of each.  I then said, what do you think 6 might look like?  She quickly pulled over 6 beads.

We tried a few more numbers within 10 and then I askedIMG_4705 her to show me 16.  She stared blankly at me for a minute and then pulled over 6 and stopped.  I said, Hmm, let’s think about what the number 16 looks like, can you find it on the number line for me?  She pointed to it and I said, you’re right!  There are 6, but what does the one tell us?  She said one ten.  I said now show me that one ten very quickly on the rekenrek.  She did and then I said and what would 6 more look like.  She showed me and looked at me for praise:)  I said, hmm, what is 10 and 6 is that 16?  She looked puzzled and said no.

I pulled out the place value arrows.  I said find the arrow that IMG_4704shows 10, now find the arrow that shows 6.  Slide them together.  What number is that?  She said 16 with a big grin on her face.  I asked, were you right?  She said yes:)

I asked if she wanted to try some more and she did!  We worked on several numbers in the teens and then I asked her if she wanted a challenge.  She nodded.  She was able to show me several numbers to 100 with the rekenrek and place value arrows.  I started by having her pull over numbers in the 20’s and she was very quickly able to do so.  We IMG_4706continued with a few more numbers while also making the numbers with place value arrows.

We had a brief discussion about why she thought the colors on the rack might change halfway down.  She said because the top is 5 tens or fifty.  I asked her why they might change at fifty. She said so we can see how many tens.

This student was missing just a few pieces that kept her from connecting her knowledge to the setting on the math rack.  With a few simple questions and the right tools, she was able to be confident and successful working with 2-digit numbers.

Scaffolding math instruction can be very challenging for teachers.  Not because they aren’t great teachers, but because they lack the knowledge of early numeracy acquisition and the tools for connecting concepts.  In my next blog post, I will share some of my favorite math tools and manipulatives that I think every teacher should use regularly to scaffold instruction.

So why is subitizing important for place value concepts?  Students need these opportunities in order to visualize numbers.  This is especially important as students start to add a 2-digit number plus a multiple of ten and as they add IMG_4411a 2-digit number and a 1-digit number.  If a student is able to visualize a number (67) on the math rack (see picture) it becomes very easy for them to visualize how many more to get to the next decade (3 are missing) or to 100 (33 are missing).  This leads to more advanced addition strategies by decomposing numbers instead of relying on finger counting and number lines to count on.

For example if I want to add 67 + 8, I know that 3 more will get me to 70, and then I can add the left over 5 to get to 75.  Likewise, If I visualize 67 and I want to add 20, I simply imagine what two more rows of ten might look like.

Dreambox offers great teacher tools that are free for instructional use.  These can be used
for students to gain practice subitizing numbers to 10, 20 and 100.  If you do not have access to rekenreks, they are very inexpensive and easy to make using pony beads, foam, and pipe cleaners.4ff185bf5dd9341f120643bea4beb4c2.jpg


Modeling Measurement

When students face problems in measurement that ask them to make comparisons, many students aren’t sure what to pay aIMG_4658.JPGattention to or how to create a visual representation.

Many times teachers use very abstract explanations like “what is the difference between 18 and 10?”  Or they give too much away by saying things like “just subtract 10 from 18.”  Even if we do pull out a ruler, rarely do we show the comparison between the two measurements at the same time.  In order to better help students understand this concept, we must make it more visual for them and teach them how to write a visual representation of the comparison model.

One of our second grade teachers told me her students were struggling with this last week and I mentioned that a great tool to show the difference between the numbers is a number line.  A part-part-whole diagram is also a great way (and rarely used) for students to see the relationship between the numbers.

distance NL

ppw

I just happened to have a jar of different types and styles of Washi tape in my room and I suggested that she use these as a visual representation of bar modeling to show the difference between the two.  This way students could actually measure the lengths and compare them side-by-side.  And who doesn’t like Washi tape?IMG_4714

She used this model with students in small group.  When she was working with one particular student on a comparison between 15 and 32, she gave him the model to the right.  He told her he could add 7 to get to 22 and then 10 more to 32, so the difference was 17.  I wonder if writing the numbers he added (like on an empty number line) might be a great way to reinforce making friendly numbers at the same time with other students?

In this particular example, she did not have the student measure the two lengths.  Is there any value in that?  Is that the next step in scaffolding his learning?

3 Act: Stack Em Up

One of my fifth grade teachers emailed me yesterday and asked me to teach a lesson on volume next week.  I started thinking about what the students might be struggling with and decided this was a perfect example of a 3 Act math task that would clear up some misconceptions.

I grabbed my tub of 1″ foam cubes (we use them for quiet differentiated dice) and started stacking them inside a tub.  I couldn’t find a tub or box that had easy dimensions, so I thought it would be a great way to get students to work out volume, but also to ask questions about efficiency and accuracy that might help them name the need for the formula and connect it to task.

So here are the tasks and the link to the tasks in Nearpod:

Act 1:

What did you notice?  What are you wondering?

How many cubes will it take to fill the tub.  Give an estimate that is too low and one that is too high.

Act 2:

What information do you need to find a solution?

Cubes = 1 cubic inch

Without labels:

With labels:


How many cubes will it take to fill the tub?

Act 3:

Were you right?

Who is willing to defend a solution?

Who is willing to disprove an incorrect solution? (We chose this question because after watching How Mistakes Make You Smarter, we’ve been focusing on being intentional about calling attention to incorrect answers and allowing students to analyze their own and their peers mistakes.  We talked to students about this and how they are helping others become problem solvers by sharing their wrong answers)

What’s the math?

Extension:

Is this an accurate representation of volume?  Why or why not?

What could we use as a more efficient method to solve for volume that would also be more accurate?

What is the volume of the tub? (8 1/2″ x 11″)